
British Eventing’s Latest Stats — And Why They’re Worth Having
Recently, British Eventing shared a set of figures around their membership, youth programme, and leadership. The numbers are straightforward:
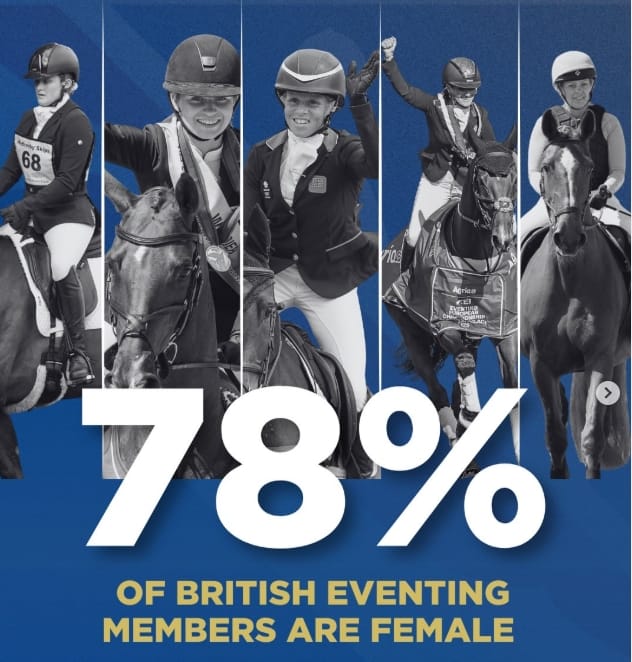
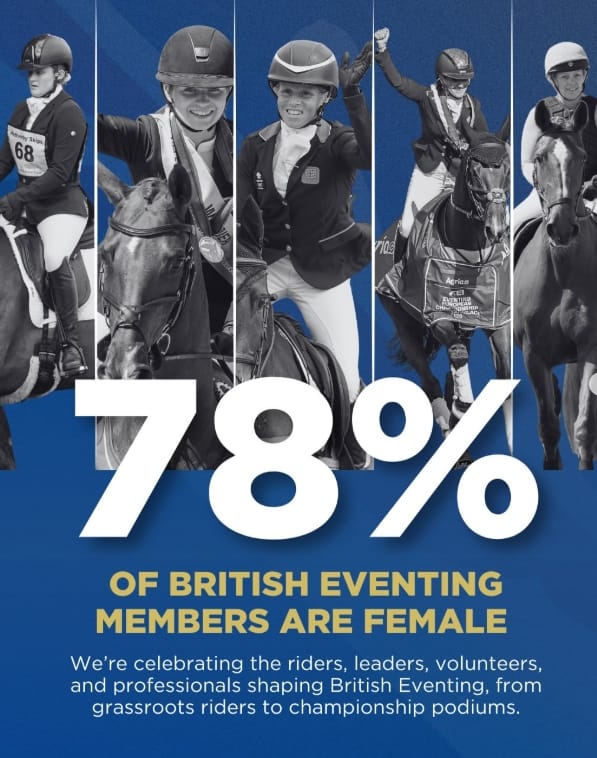
78% of members are female
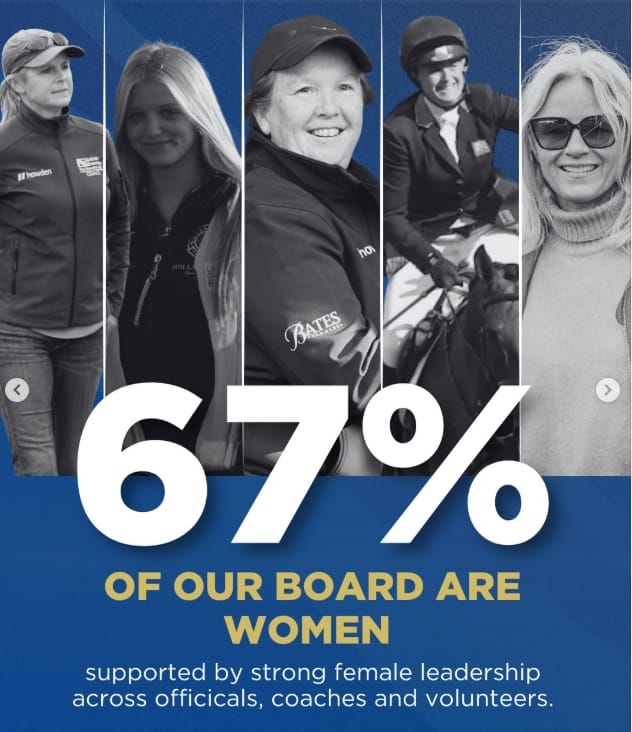
67% of the Board are women
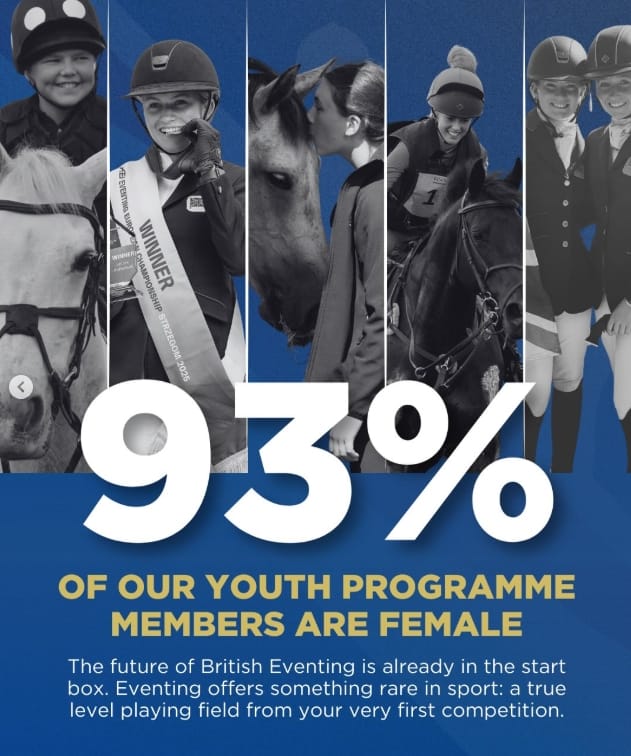
93% of Youth Programme members are female
For anyone involved in the sport, they won’t come as a shock. Walk into most yards, training sessions, or grassroots events and you’ll see a very similar picture.
What makes this different is that it’s now been measured and published.
A Strong Position for the Sport
Taken as they are, these figures reflect a sport with a very high level of female participation.
Women make up the majority of members, and that is even more pronounced at youth level. The pipeline coming through is overwhelmingly female, which has clear implications for how the sport continues to develop over time.
There is also a level of representation at leadership level, with 67% of the Board being women. That shows a degree of alignment between participation and governance that many other sports are still working towards.
On a basic level, these are positive indicators.
The Importance of Publishing the Data
The most valuable part of this isn’t just what the numbers say, but the fact that they’ve been shared at all.
Without data, most of what we say about the industry is based on observation. We can have a good sense of what things look like, but it’s difficult to quantify or track.
Once figures like this are published, they become useful.
They provide:
A clearer understanding of the current makeup of the sport
A reference point for future comparisons
A basis for more informed decision-making
They also allow for more accurate conversations, because they move things out of assumption and into something measurable.
What We Can Take From It
There are a few simple takeaways from these figures.
The youth side of the sport is heavily female, which is likely to shape the future of participation and workforce within the industry.
Women make up a significant majority of current members, which reflects the day-to-day reality across the sport.
Leadership representation is moving in the same direction, even if not exactly proportional.
That’s useful information in itself. It doesn’t need to answer every question to have value.
A Starting Point, Not a Full Picture
These figures don’t attempt to explain everything.
They don’t cover retention, progression, or career pathways. They don’t break down roles within the sport or how experiences might differ across levels.
What they do provide is a clear snapshot.
And that’s where their strength lies.
Why This Matters Going Forward
If anything, this highlights the importance of more organisations doing the same.
Collecting data.
Publishing it.
Allowing it to be understood and built on.
Because the more clarity there is around who the sport is made up of, the easier it becomes to make decisions that reflect that reality.
Final Thought
There’s nothing complicated about these figures, but they are useful.
They confirm what the sport currently looks like and provide a solid reference point for where it goes next.
And sometimes, having that clarity is exactly what’s needed.